code complexity in smart contracts protocols part 1
measuring protocol complexity with betterscan
In this series of articles, I aim to present an alternative method for modeling code complexity in smart contracts. Current metrics such as CK, Martin, or Halstead are well-known and widely used, yet they focus only on individual code units (contracts) and do not account for a network of contracts, which I define here as a “protocol.” I propose a solution that broadens complexity measurements to include the entire protocol. Throughout this series, I will develop a graph model to map the interconnections of a protocol’s smart contracts that will serve as a backbone for formalizing the complexity measurment in the future.
I will be working with Betterscan for downloading, parsing, modeling and visualizing all of the necessary data. Betterscan is a tool I’ve built for inspection and security analysis on top off crytic-compile and slither. Originally intended for security-oriented inspection of on-chain addresses, it runs automatic analyses, enables complex code searches, and more. However, it also proved to work remarkably well when paired with graphing tools like networkx. Betterscan is still in development so certain amount of “hacky” solutions was required to finalize this article. Yet, it’s possible to replicate all of it with the currently available version of the app on github. Currently, it might be a bumpy experience, though. For inquiries, collaboration offers, or support, feel free to reach out via Twitter or GitHub.
Building Graphs
Before delving deeper, it’s crucial to introduce the fundamental concepts of graphs through formal definitions. As we proceed, I’ll frequently reference these concepts in the context of a smart contracts network.
A graph consists of a set of nodes (or vertices) denoted as V and a set of edges E. Each edge represents a link (ordered or unordered) between pairs or groups of nodes, defining their connections. The ‘order’ of a graph corresponds to its number of nodes, while the ‘size’ of a graph indicates the number of edges. The ‘degree’ of a node is defined by the number of edges connected to it. Edges can be undirected, directed, weighted, or unweighted, each type influencing the graph’s structure differently. For Betterscan, I construct a directed (to reflect the directionality of external calls) but unweighted (no distinction is made between types of calls) graph.
Defining the Protocol Graph Model
-
A protocol is a set of distinct contracts deployed to individual addresses that interact through calls, dependencies, reads, or writes, forming a network of nodes and edges.
-
A single contract (at address) is represented as a node.
-
An external call (regardless of it’s type) between two or more contracts is represented as an edge.
-
An isolate is a single contract (or a library) deployed as part of the protocol but not connected to the rest of the protocol by an edge (an external call).
-
The terms ‘cluster,’ ‘core,’ and ‘periphery’ describe the characteristics of nodes within the network. Cores and peripheries are determined by their degree of centrality, while clusters are identified through ‘strongly connected components’ within the network. Currently, Betterscan models the graph network using only external calls, not considering other source code data, which means the classification into core or periphery, or whether nodes form part of a cluster, depends solely on these calls. The direction, type, or potential impact of a call is not yet considered.
-
There’s also a special case of “ZERO_ADDRESS”. Commonly found in most protocols, the ZERO_ADDRESS often signifies levied access control or an undefined storage slot. To avoid skewing centrality scores, this address is excluded from analyses.
This exploration is preliminary. It was tested on a select few protocols using a basic approach to construct a graph from smart contract interactions. Future parts of this series will address a more robust selection and weighting of features for both nodes and edges, as well as a deeper formalization of complexity calculations akin to the CK, Martin, or Halstead metrics.
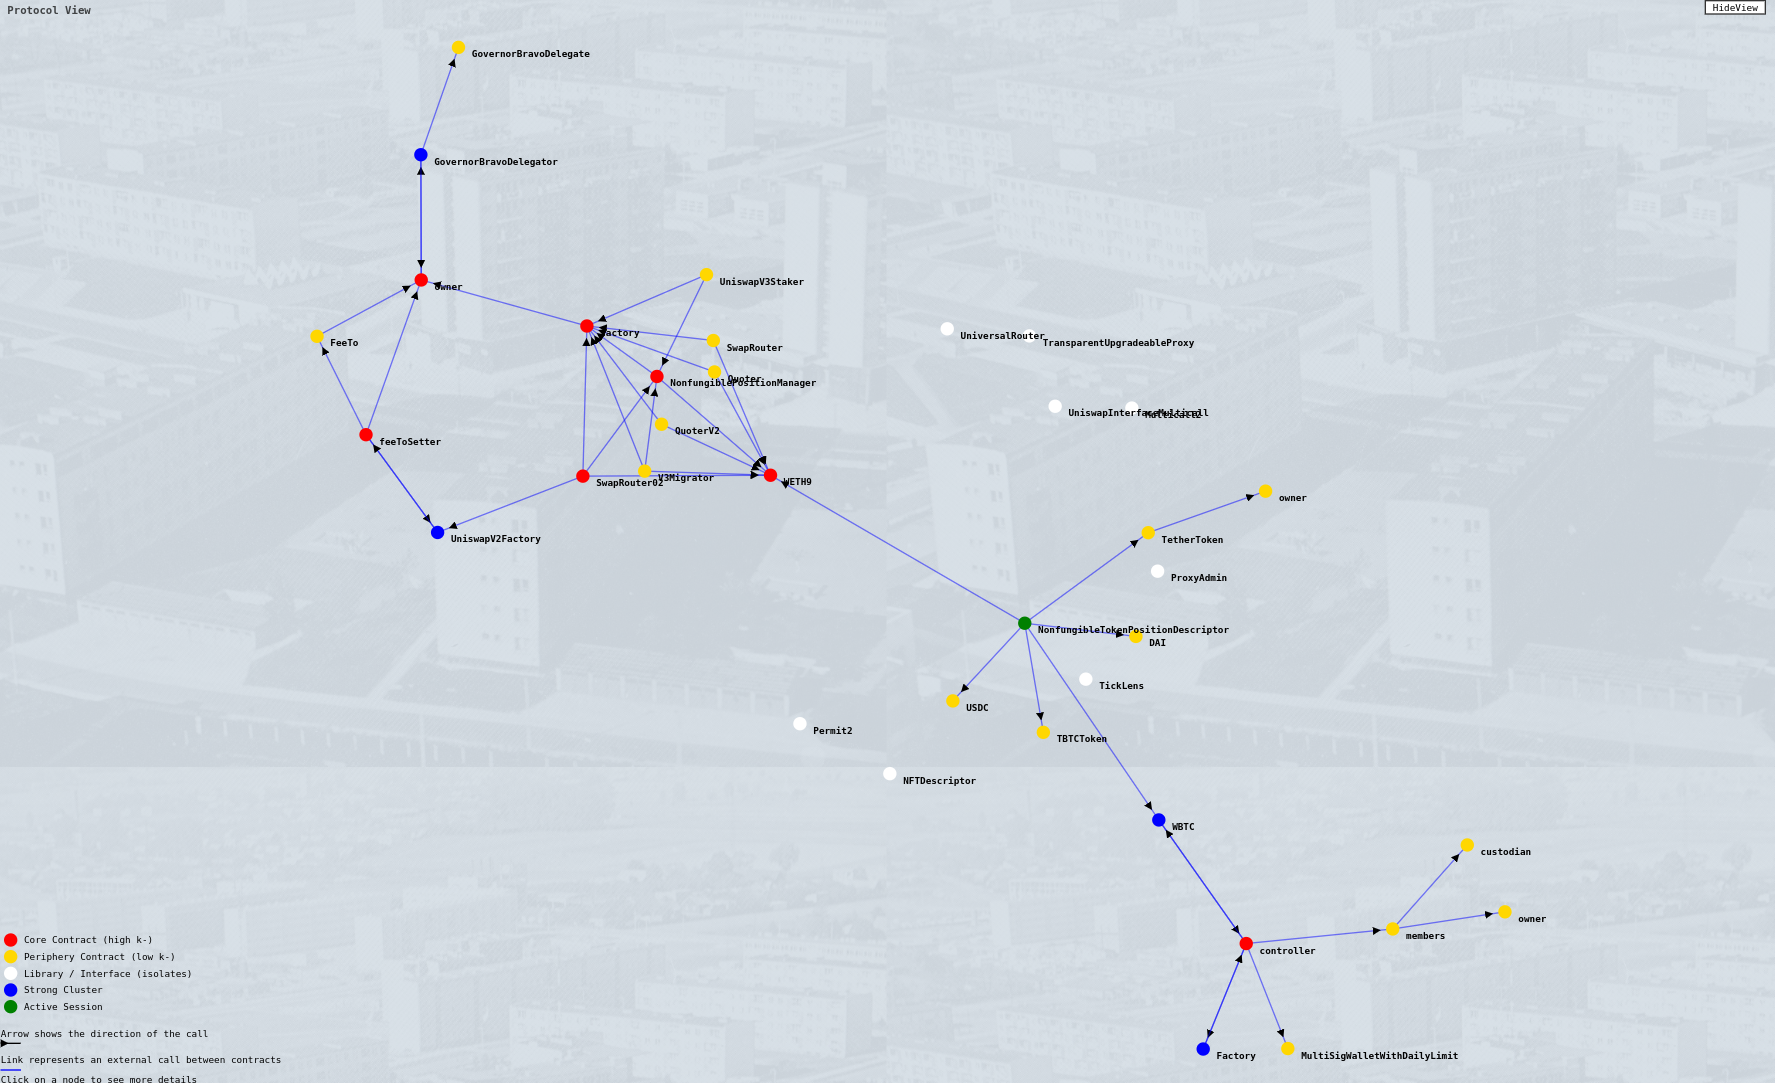
A protocol view of UniswapV3 generated by Betterscan. Red circles represent “core” contracts, yellow ones are “periphery,” and white are “isolates.”
Target Protocols
I will be analyzing Uniswap, ENS, LayerZero, and SuperForm as examples of protocol network complexity. The choice is arbitrary (I worked for SuperForm, though), as each protocol exhibits sufficiently distinct network characteristics to serve as good examples.
Discovering Protocol’s Network
One of the initial and already less obvious observations is the discrepancy between the number of contracts officially published by the protocol and the actual number discovered by Betterscan. This gap highlights an increase in the size and order of the network (the sum of contracts and their calls) due to the additional contracts found.
| Protocol | Deployed | Discovered |
|---|---|---|
| ENS | 24 | 31 |
| SuperForm | 18 | 26 |
| Uniswap | 17 | 32 |
| LayerZero | 9 | 17 |
Discovery is performed using Betterscan. Official deployment addresses are packed into ‘addresses.csv’ and ran with
runner.py --csv addresses.csv --crawl_level 0. The “Deployed” column lists the number of contracts officially declared by the protocols.
The discovered contracts, though not included in the protocols’ official listings, are integral to the network. While exclusion from official documentation may be justified from a business or development standpoint, it impacts the complexity and security landscape of the protocol. Moreover, some of these discovered contracts have secondary, external dependencies that further detach them from the original protocol contracts. Using Betterscan, I am able to identify and incorporate these dependencies into our model of the protocol’s network, enriching understanding and assessment of its complexity.
Protocol’s Network Structure
The table below provides a comprehensive overview of the network structure for different protocols. For instance, the ENS protocol consists of 32 individual contracts, including those with bytecode-only addresses. It features 30 external calls (represented as edges), 5 core contracts at the center of the network, and 27 contracts that interact with these cores. Notably, 9 contracts—typically libraries, proxies, or other delegator contracts—do not engage directly with either core or periphery contracts. There are no clustering within this network. This overview offers a valuable “bird’s-eye view” of the protocol’s structure on-chain, providing a clear estimation of its size and organization. When using the Betterscan app, this data is visually represented in a color-coded graph, allowing for detailed inspection of external calls between nodes and utilization of various other Betterscan functionalities.
| Protocol | Nodes | Edges | Cores | Periphery | Isolates | Clusters |
|---|---|---|---|---|---|---|
| UniswapV3 | 36 | 41 | 8 | 28 | 8 | 3 |
| ENS | 32 | 30 | 5 | 27 | 9 | 0 |
| SuperForm | 28 | 32 | 6 | 22 | 1 | 1 |
| LayerZero | 22 | 23 | 4 | 18 | 2 | 1 |
The table above represents the basic structure of each protocol’s network, defining elements such as nodes, cores, peripheries, isolates, and clusters, where a cluster includes at least three contracts.
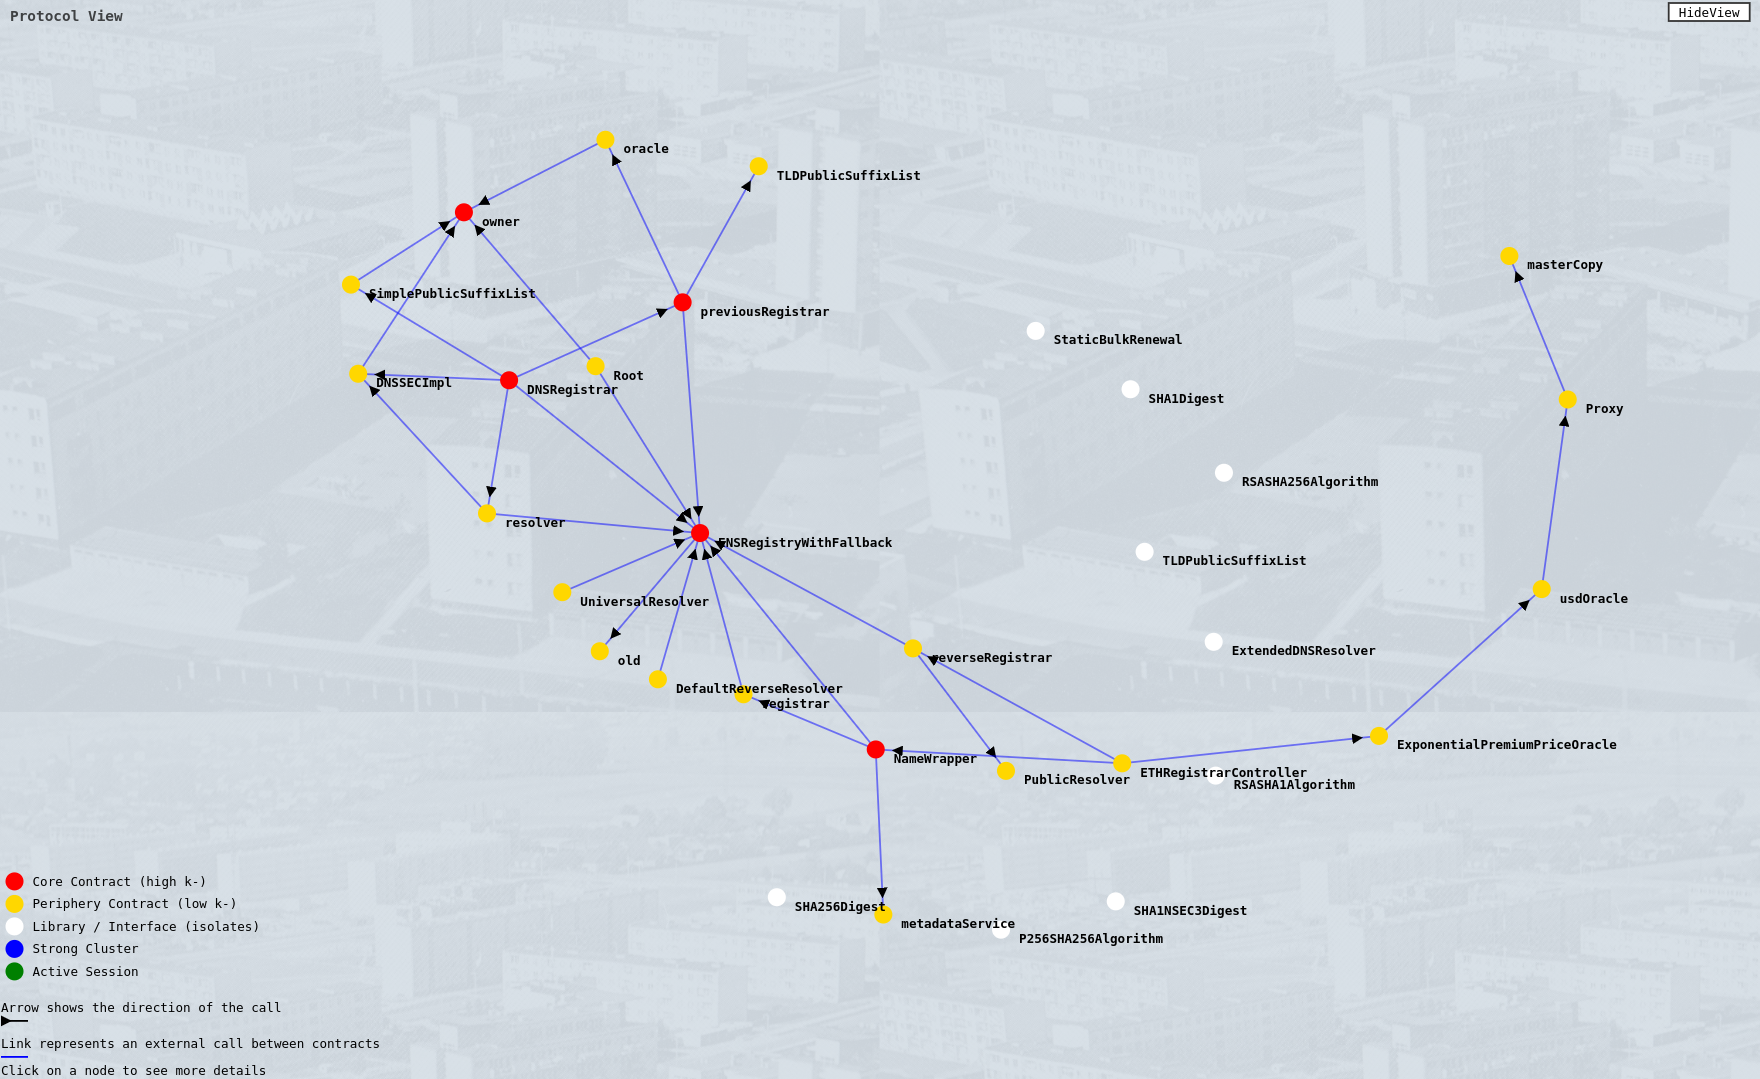
View of the ENS Protocol
Comparing the ENS protocol structure to that of LayerZero highlights the importance of the visual aspects of network modeling.
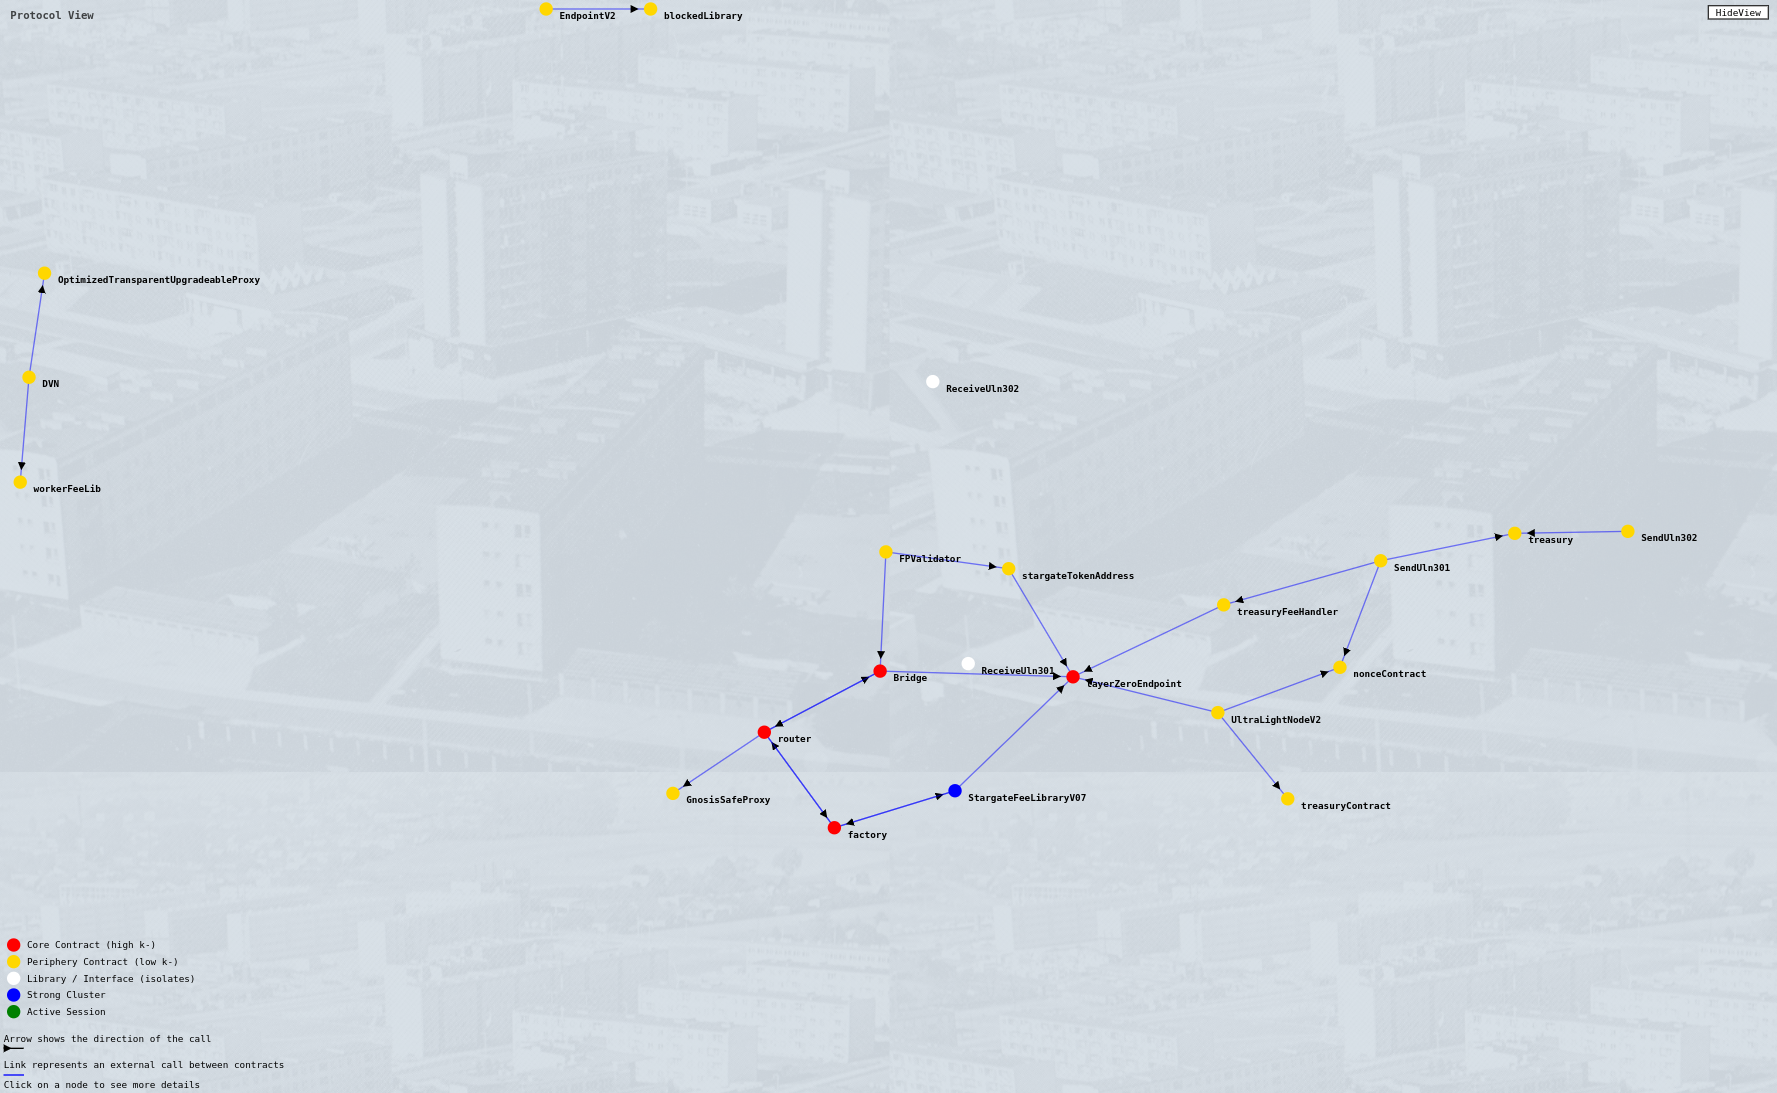
View of the LayerZero Protocol. Note the set of detached contracts recognized as peripheral yet still forming a significant pattern of interaction.
Degree of Centrality of Protocol and it’s Nodes
The “degree of centrality” is a crucial metric that determines whether a smart contract (node) within the protocol’s network is classified as a core or periphery contract. This degree is influenced by the total number of external calls a contract sends and receives relative to others in the network. Technically, it is calculated based on the number of edges incident to a node, with the premise that more edges indicate greater centralization. This influences decisions on defining edges in the network model. The centrality value, normalized between 0 and 1, illustrates the connectivity of the network: a value of 0.0 implies no connections between nodes, while 1.0 indicates that every node is connected to every other node. Used in this analysis nx.degree_centrality(G) is treating the network as undirected, it is possible to also calculate “in” and “out” degree of centrality of nodes, but currently it remains out of scope.
This metric is essential for identifying the core structure of the protocol’s network in the current version of Betterscan. By calculating the degree of centrality, we can establish a “threshold” value to distinguish core contracts from periphery contracts and find areas of increased protocol risk. However, the centrality value alone is insufficient to label a protocol as “centralized”, other derived data and visual inspections of the graph are also essential to understand the impacts of these values. It’s also worth remembering that the concept of centrality here is only discussed in terms of source code interactions, not in the sense of protocol’s control over the code.
| Protocol | Centrality | Threshold | Average core | Average periphery |
|---|---|---|---|---|
| LayerZero | 0.0995670995671 | 0.142857142857143 | 0.214285714285714 | 0.074074074074074 |
| SuperForm | 0.084656084656085 | 0.074074074074074 | 0.216049382716049 | 0.048821548821549 |
| UniswapV3 | 0.065079365079365 | 0.085714285714286 | 0.160714285714286 | 0.037755102040816 |
| ENS | 0.060483870967742 | 0.096774193548387 | 0.174193548387097 | 0.039426523297491 |
Whether a contract is a core or periphery is determined by its degree of centrality. If a contract’s centrality is below the 75th percentile of all contracts’ centralities, it is categorized as a periphery. This 75th percentile acts as the “Threshold.” The average degrees of centrality for core and periphery nodes provide deeper insights into how centrality is distributed within the structure of the protocol’s contracts. Note the slight differences in centrality between LayerZero and SuperForm, largely attributable to the average centrality of peripheral nodes, while their core centrality figures are quite similar.
Betterscan utilizes built-in networkx utilities for performing centrality calculations:
    # Calculate degree centrality for each node
    degree_centrality = nx.degree_centrality(contract_map_scan.graph)

    # Determine a threshold for core nodes (e.g., 75th percentile)
    threshold = np.percentile(list(degree_centrality.values()), 75)

    # Classify nodes as 'core' or 'periphery' based on the threshold
    core_periphery_map = {
        node: "core" if centrality > threshold else "periphery"
        for node, centrality in degree_centrality.items()
    }
Core & Periphery Contracts of Protocols
Core contracts can significantly influence the centralization of a protocol. Multiple core contracts may exist depending on the protocol’s complexity. Identifying these core contracts from just the smart contracts’ code or deployment lists might not be straightforward. However, within a protocol network view (where core contracts are marked with red nodes), they are readily identifiable.
Cores can also form outside of the protocol’s deployments, within the group of “discovered” addresses. For example, SuperForm utilizes LayerZero for sending cross-chain calls, you’ll notice that one of the cores of SuperForm protocol is actually formed around lzEndpoint that on it’s own is not a part of SuperForm managed contracts, but it does interact with it through both SuperForm managed ERC4626Form (core) and LayerZeroImplementation (periphery) contracts.
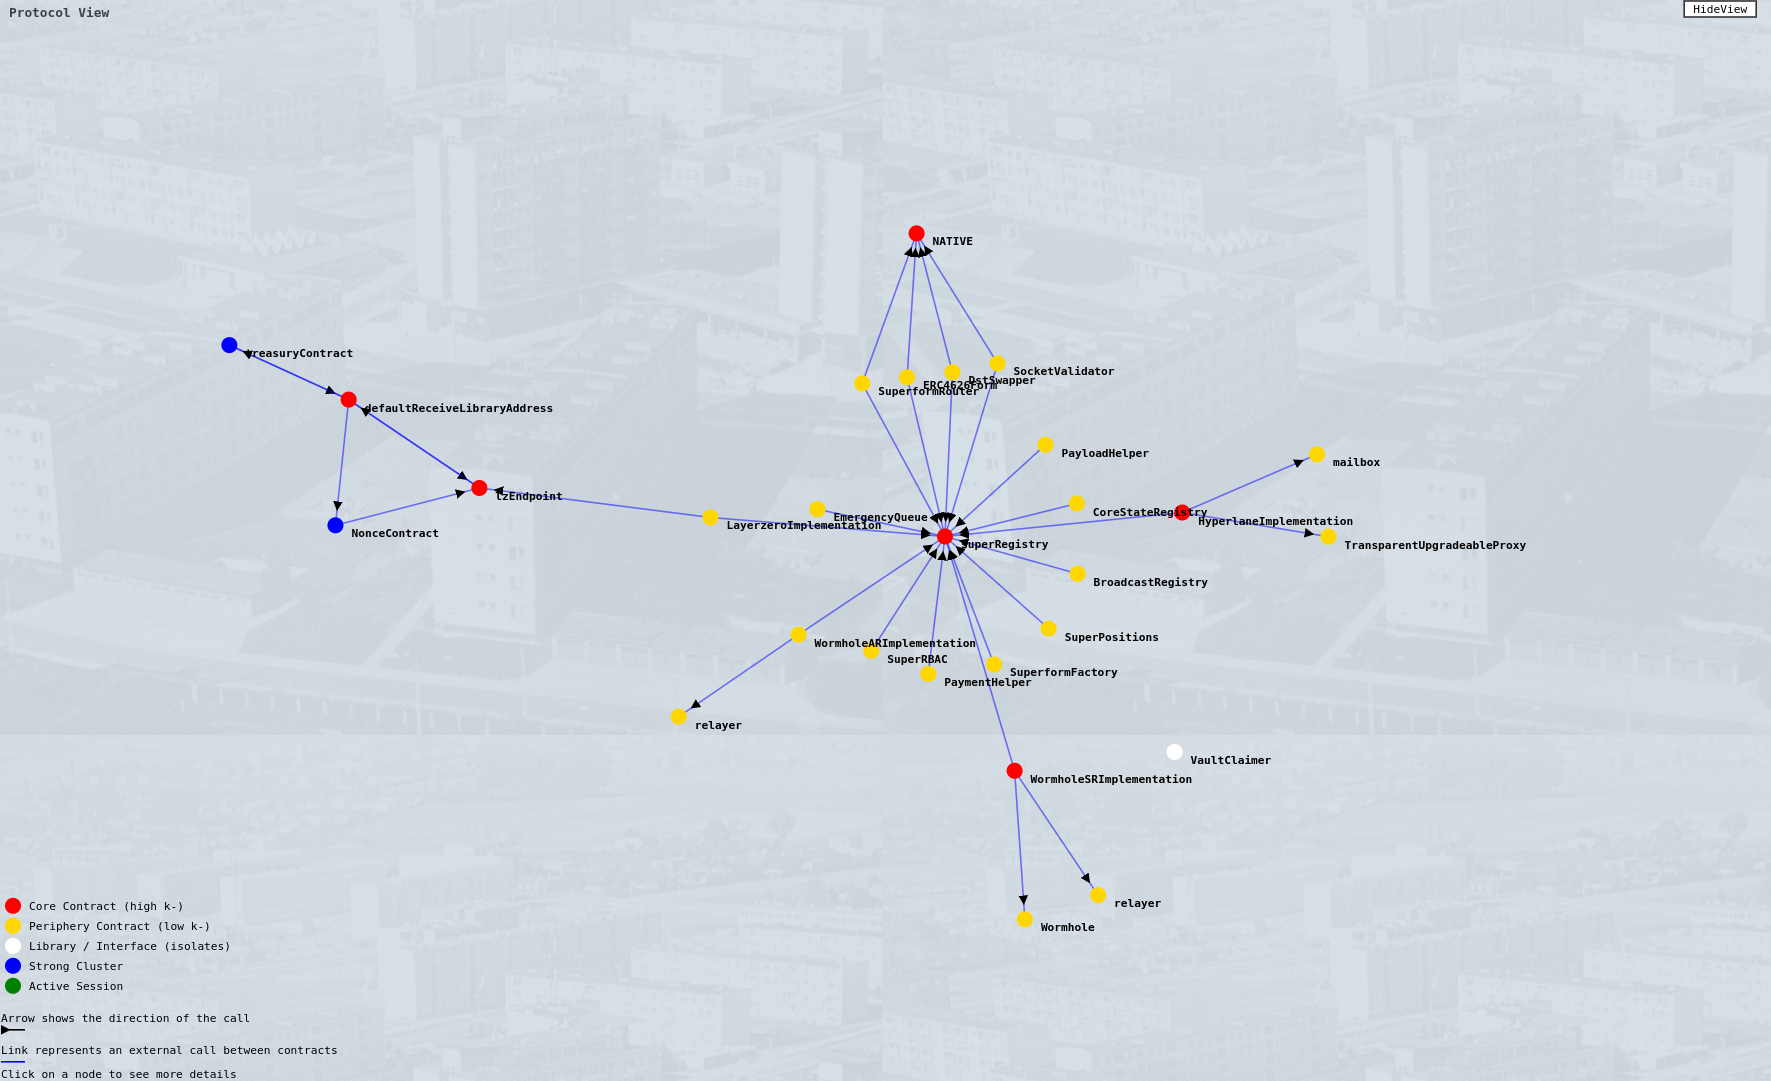
View of the SuperForm protocol. Notice the centrality of SuperRegistry, marked by a Core/Max value of 0.5925—the highest among all examined protocols.
A periphery is a contract (gold colored node) that’s defined by lower “connectedness” with other contracts (most likely cores but not necessarily). A periphery node, with a centrality less than the 75th percentile threshold, can still be significantly connected up to 𝑛+1 nodes, where 𝑛 is the number of nodes with degree of centrality up to the 75th percentile threshold. This setup demonstrates that peripheral nodes can still exert significant influence or interaction potential within the protocol’s network structure. Currently, Betterscan does not assess the specific impact of a call, it merely records the existence of any interaction, which slightly diminishes the perceived importance of periphery contracts.
Differences in the maximum centrality values (Perip/Max) observed between protocols highlight distinct network dynamics. For example, LayerZero features highly connected peripheral contracts, while SuperForm exhibits a standout contract that receives numerous calls within the network.
| Protocol | Node Type | Contract Name | Centrality |
|---|---|---|---|
| ENS | Core/Max | ENSRegistryWithFallback | 0.32258064516129 |
| ENS | Core/Min | owner | 0.129032258064516 |
| ENS | Perip/Max | reverseRegistrar | 0.096774193548387 |
| ENS | Perip/Min | PublicResolver | 0.032258064516129 |
| LayerZero | Core/Max | layerZeroEndpoint | 0.238095238095238 |
| LayerZero | Core/Min | factory | 0.19047619047619 |
| LayerZero | Perip/Max | StargateFeeLibraryV07 | 0.142857142857143 |
| LayerZero | Perip/Min | workerFeeLib | 0.047619047619048 |
| SuperForm | Core/Max | superRegistry | 0.592592592592593 |
| SuperForm | Core/Min | WormholeSRImplementation | 0.111111111111111 |
| SuperForm | Perip/Max | ERC4626Form | 0.074074074074074 |
| SuperForm | Perip/Min | mailbox | 0.037037037037037 |
| Uniswap | Core/Max | factory | 0.228571428571429 |
| Uniswap | Core/Min | feeToSetter | 0.114285714285714 |
| Uniswap | Perip/Max | UniswapV2Factory | 0.085714285714286 |
| Uniswap | Perip/Min | GovernorBravoDelegate | 0.028571428571429 |
The table details the maximum and minimum degrees of centrality for individual core and periphery nodes within each protocol.
Strong Clusters of Interaction in Protocols
Following the degree of centrality, another vital metric in protocol’s network modeling is the detection of “strongly connected components,” which Betterscan defines as “Strong Clusters.”
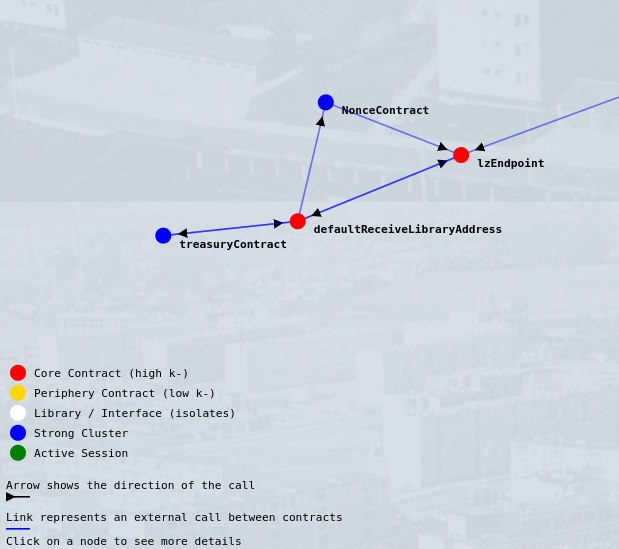
A Strong Cluster is a subgraph within the protocol’s graph where every node (contract) is reachable from every other node in the same subgraph. This indicates that all contracts within the cluster interact intensively, serving both as senders and receivers of calls. This interaction pattern differs from scenarios where calls are centralized to a single sender/receiver contract (high Core/Max value, high Threshold) or cascade down the call chain (low Average Periphery value). Strong clusters typically exhibit bi-directional call “triangles” within the subgraph of the protocol network.
| Protocol | Clusters | Strength | Sizes |
|---|---|---|---|
| UniswapV3 | 3 | 6 | 3, 2, 2 |
| LayerZero | 1 | 2 | 4 |
| SuperForm | 1 | 2 | 4 |
| ENS | 0 | 0 | 0 |
Clusters signify areas of high interactivity and potential complexity, where contracts often maintain numerous and intricate state dependencies. The “Strength” value, measures the internal interconnectedness of these clusters. Unlike the traditional network density, which is defined as the number of actual edges divided by the number of possible edges and ranges between 0 and 1, the “Strength” in Betterscan is calculated by multiplying the subgraph’s density by its size (number of nodes). This calculation provides a value that reflects both the density and the scale of the cluster, thus extending beyond the 0-1 range. This method captures not only how interconnected the nodes are but also emphasizes the size of the interconnected group, offering a more nuanced understanding of the cluster’s impact within the protocol network.
    scc_ids = set()
    scc_sizes = []
    cluster_strength = 0
    for component in nx.strongly_connected_components(contract_map_scan.graph):
        # Build all potential strongly connected components
        subgraph = contract_map_scan.graph.subgraph(component)
        # Select only components with at least 1 edge
        if subgraph.size() > 0:
            scc_ids.update(component)
            scc_sizes.append(len(component))
            # Calculate the density of the subgraph
            density = nx.density(subgraph)
            # Add the product of the size and density to the cluster strength
            cluster_strength += len(component) * density
Clusters are crucial sources of complexity within the protocol, demanding careful consideration when implementing or interacting with contracts within these clusters, particularly those not directly controlled by the protocol. It is possible for a protocol network to exhibit no clusters, particularly when the connections between core and periphery nodes are insufficient or predominantly one-directional. A smaller number of clusters typically indicates less obscured complexity within the network.
Key Takeaways
-
Protocol Dependencies: The list of addresses deployed by a protocol may not fully represent all of the protocol’s dependencies. Complexity and additional risks often lurk within those components of the protocol that need to be discovered.
-
Network Size vs. Centrality: The size of the protocol network (contracts x calls, or nodes x edges) does not directly correlate with centrality. The centralization of a protocol is more intricately tied to the structure and individual properties of the protocol, which are challenging to quantify but can be more readily assessed through visual inspection.
-
Understanding Network Dynamics: It’s crucial to grasp the nuances of the protocol network:
- Threshold Value: At what point does a node become central to my protocol’s structure?
- Centralization Degree: How strongly centralized are these core nodes?
- Interconnection: How interconnected are the central and peripheral parts of the protocol? This is depicted by the average minimum and maximum centrality values for core and periphery nodes.
-
Complexity Patterns: Observations from the network model of the protocol can reveal complex patterns:
- A high Core/Max value indicates the presence of a significantly central contract.
- A low Average Periphery value typically signifies a hierarchical chain of calls descending through the contract stack.
- Strong clusters often manifest as patterns of bi-directional call “triangles” within the subgraph of the protocol network, highlighting areas of dense interactivity.
Epilogue
In Part 1, we have not yet developed a definitive formula to measure protocol complexity. However, using the foundational concepts discussed, I am ready to refine this further in Part 2. Stay tuned.
Betterscan is a project situated at the crossroads of data modeling, visualization, program analysis, and smart contract security. The aspects of protocol network complexity discussed here represent just one facet of the capabilities Betterscan offers. The networks depicted are merely one of several ways to define them. Quantifiable metrics for evaluating the complexity of a protocol remain under development, with many nuances yet to be explored. These nuances could significantly alter our understanding of a protocol’s risk profile. In this article, I presented a simplified view of protocol networks to introduce an alternative method of modeling code complexity in smart contracts using network graphs and selected features from Solidity. It’s important to note that the outcomes of network analysis are highly dependent on specific choices, such as degree thresholds, attribute weights, and the directionality of connections.
If you are interested in collaborating or have questions, feel free to reach out to me at @blackbigswan.